Resources for Transport Professionals
Design guides
Healthy Active by Design
Austroads guides
- Facilitating Speed Management Change: Example Case Studies from Australia and New Zealand. This report is a case study-based examination of the information and approaches that can be used to counter some of the most significant myths and barriers relating to speed management. The evidence provided in this report can be used to better engage with the public and decision-makers about the need for speed change and the broad benefits that this change will bring.
- Improving Austroads Guidance for Cycling and Micromobility Planning. The purpose of this report is to provide recommendations to improve the current guidance on cycling and micromobility planning in Austroads’ Guide to Traffic Management (AGTM). This is done by proposing strategic changes to the current guidance based on best practice literature, addressing gaps identified by key stakeholders, and recommending specific changes based on a detailed review of the current AGTM.
- Review of Movement and Place Guidance. This report presents the research to support transport agencies in developing and implementing Movement and Place frameworks.
- Pedestrian Tool. The online tool assesses the viability of different types of pedestrian crossing facilities according to the physical and operational parameters of a site and its safety performance. It can be used to assess both mid-block and intersection locations.
- Pedestrian Guidance. examines current pedestrian planning guidance in the AGTM and Guide to Road Design. It identifies gaps and opportunities to improve safety, accessibility, and inclusivity for people walking or wheeling, with and without assistive devices. The review emphasises Safe System, Universal Design, and Movement and Place frameworks to support equitable pedestrian outcomes..
Good Growth by Design
Good Growth by Design (GGbD) is the Mayor of London’s programme to shape a better city by promoting quality and inclusion in the built environment.
The programme comprises projects and policies promoted across the Greater London Authority (GLA) Group, but also a call to action to architects, urban designers and other built environment professionals working in London.
The Good Growth by Design sets out an integrated programme of work that seeks to enhance the design of buildings and neighbourhoods for all Londoners. It proposes drawing together existing design and placeshaping expertise, and using the skills of the Mayor’s Design Advocates, and the built environment sector as a whole, with teams within the Greater London Authority Group (GLA Group1), the London boroughs and other public bodies. The programme has six pillars.
- Setting standards and informing delivery
- Ensuring quality
- Building capacity
- Supporting diversity
- Commissioning quality
- Championing learning
You’ll find the comprehensive set of guides here.

School streets
Here’s a list of some useful resources and links that should help you start the conversation with other parents, the school leadership, residents associations and elected representatives.
A School Street is a road outside a school with a temporary restriction on motorised traffic at school drop-off and pick-up times. The restriction applies to school traffic and through traffic. The result is a safer, healthier and pleasant environment for everyone.
School Street schemes offer a proactive solution for school communities to tackle air pollution, poor health and road danger reduction. A School Street scheme will encourage a healthier lifestyle and active travel to school for families and lead to a better environment for everyone.
Find out more how you can start the conversation for your school and build the case for a School Street.
Click here for a full list of resources.

Putting our best foot forward: A checklist for walkable density
This Committee for Sydney checklist is designed as a simple tool to allow anyone to understand if a future development is likely to be walkable. What this checklist is:
- Targeted at residential or mixed use development.
- Draws from extensive research into the factors that influence walking, and is designed to provide a clear and easy method for determining if the key factors have been met.
- Helps identify key gaps that are specific to issues around walkability, with the intention of prompting users to think of solutions to these gaps, which may vary depending on context.
You’ll find the checklist here.

Planning and design for walking in the Netherlands:
An action manual
The Four Pillars of Walking-Friendly Design
1. Meaningful: Integrate walking into daily routines through storytelling, branding, and campaigns that connect walking to work, learning, and socialising.
2. Normal: Redefine walking as a desirable component of good living, linked to shared values of freedom, comfort, safety, and sustainability. Car-free developments can accelerate this cultural shift.
3. Easy: Create compact, walkable, connected spaces with clear wayfinding and inclusive “walk & roll” accessibility for all mobility levels.
4. Enjoyable: Design for diversity guided by eye-level experiences of liveliness, greenery, and weather protection.
The City of Zwolle case study exemplifies these principles in action, transforming a mono-functional car-oriented area by converting parking spaces to housing and reimagining the A28 highway as a green boulevard. This demonstrates the “traffic evaporation” principle – reducing car space leads to behavioural adaptation rather than just traffic displacement.

Creating places that work for women and girls handbook for local authorities, developers and designers
Designing cities that cater to women and girls will make public realm safer and more equitable and inclusive for everyone. By adopting gender-informed urban design principles, built environment sector can play an important role in addressing gender inequality. This can ensure fair access to services and opportunities, thereby advancing the socio-economic mobility of women and girls. This will not only improve, protect, and empower the lives of women and girls but will also unlock the full potential of both our public realm and individual developments to influence wider issues such as climate change mitigation, sustainable development, and economic growth.
You’ll find the guide here.

Girls Just Want to Have Fun, a design guide for adolescent girls
How do we design a better public realm for adolescent and teenage girls?
Girls and women experience the built environment distinctly differently than boys and men. They use and navigate it differently, from trip chaining between work, school, and home to selecting specific travel routes as required by their caregiving responsibilities or feelings of safety. They also face unique physical, social, economic, and symbolic barriers to its use – barriers that geographer Leslie Kerns notes “shape their daily lives in ways that are (although not only) gendered.” Here’s the Perkins Will guide.
Comment on the Perkins Will and Henning Larsen‘s Urban Minded guides by Remco Deelstra. “Both the P&W and HL reports aim to improve urban public spaces for adolescent girls, acknowledging their distinct experiences and overlooked needs. Both identify safety concerns, exclusion through boy-centric design, and negative perceptions of girls “hanging out” as key issues. However, their focus and methodology differ. P&W broadly targets better public realms for girls aged 13-18, using literature reviews and expert interviews. Their key themes are Adolescent Development, Societal Constructs, and Teens in the Public Realm, proposing design drivers of Fun, Flexibility, and Freedom. HL specifically explores how urban design impacts the mental well-being of girls aged 14-16 in Copenhagen, through direct engagement (interviews, workshops). HL introduces “Inbetween-ness” and drivers: To FLOW, To BE, and To PLAY in the city, linked to psychological needs. P&W offers practice, process, and general design recommendations. HL provides a detailed design guide with concrete strategies. P&W was notably inspired by HL’s earlier work.”


Travelling in a woman’s shoes
How do we design sustainable transport that everyone will use and love? Supporting women and their travel needs will help Ireland transition to a carbon-neutral transport system. Historically, transport has not been designed with the needs of women in mind. This study seeks to fill important gaps in our understanding, in order to encourage wide adoption of sustainable transport. The study explores the drivers of car dependency for women including transport infrastructure, significant caregiving responsibilities, safety concerns and equality of access to quality services. Throughout the report policy opportunities are identified to provide a way forward. This study shows us that designing transport that people will use and love requires new ideas and a new level of gender sensitivity in policy and practice.
You can click here for the report on understanding women’s needs to inform the future of transport policy and design.w

Design guides for walking, wheeling, riding
“SAFER PARKS: Improving access for women and girls” introduces ten core principles organised around three key themes:
Eyes on the Park focuses on increasing human presence through strategic activation. This includes positioning popular facilities in busy areas, creating circular walking routes, and ensuring visible staff presence, particularly during winter afternoons when women feel most vulnerable.
Awareness addresses design elements that enhance women’s ability to assess their surroundings. Key interventions include maintaining low shrubs with high tree canopies for clear sightlines, ensuring wide and visible exits, implementing even lighting with warm colours, and creating clear wayfinding systems.
Inclusion emphasises involving diverse groups of women and girls in design processes. This encompasses creating spaces that signal belonging, maintaining high standards of cleanliness and maintenance, and ensuring safe access routes to and through parks.
Success measurement involves collecting gender-disaggregated data on park usage and safety perceptions, moving beyond traditional crime statistics to capture the daily experiences that deter women and girls from using public spaces.
You can read the guide here and Remco Deelstra’s post here.

Design guides for walking, wheeling, riding
The Improving Austroads Guidance for Cycling and Micromobility Planning report recommends improvements to the current cycling and micromobility planning guidance in Austroads Guide to Traffic Management (AGTM). The report presents the research to support the recommendations
This report also introduces three key tools to assist planners and decision-makers:
- Cycling Level of Service (CLoS) Tool (Excel file |259 Kb) – Assesses the quality of cycling routes by evaluating factors such as safety and comfort, ensuring infrastructure meets user needs.
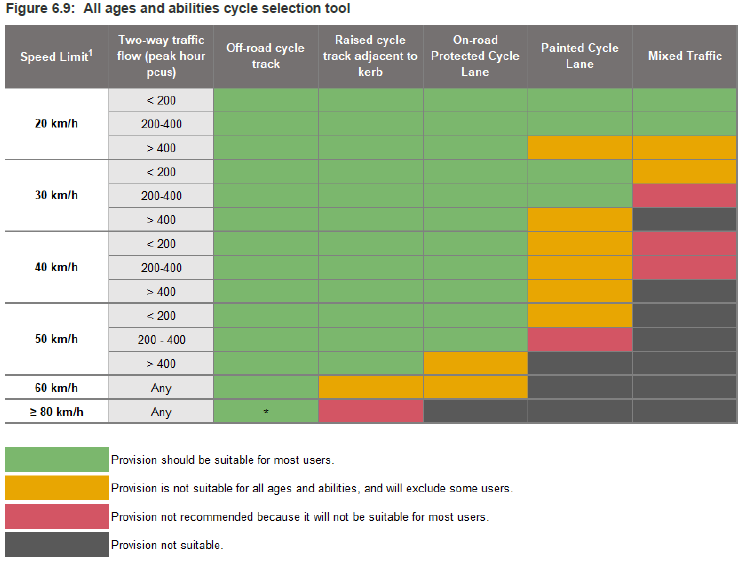
- An All Ages and Abilities (AAA) Cycle Facility Selection Tool (Excel file |156 Kb) – Helps planners choose the most suitable cycling facilities based on local context and traffic conditions.
- Crossing Selection Guide (Excel file |148 Kb) – Assists in determining the most appropriate crossing type for people on bikes, considering speed limits and site-specific factors.
—
The Tasmanian Walk, Wheel, Ride Guidance has been developed to support practitioners to design new cycling infrastructure, or to upgrade existing routes. The guide seeks to complement existing guidance (such as Austroads) to achieve better design outcomes that respond to the local context. The principles and treatments in this guide are applicable throughout Tasmania. In particular, the guide supports the design of on-road treatments. Our aim is that all new cycling infrastructure is suitable for all ages and abilities (AAA).
—
To help designers, planners and governments make the best possible use of our most important public spaces, Transport for NSW updated the Design of Roads and Streets (DORAS) manual. You can read Bicycle NSW’s excellent review here. For 70 years, planners and engineers have prioritised the movement and storage of private vehicles when designing our roads and streets. Car-dominated streets are so normal that most people in the community can’t imagine things being any other way. But roads and streets are for everyone! DORAS clearly differentiates between roads and streets and helps designers untangle the two typologies. Dozen of typologies are clearly presented with great graphics. There are encouraging guidelines on providing for cycling. 30km/h limits are an important tool. And a much more ambitious vision is needed for arterial roads! Click to find Bicycle NSW’s policy articles.

A Design For Life: Urban practices for an age-friendly city
The UK will see a rapid increase in older urban residents over the next two decades. Framing this demographic shift as a “crisis” or “time bomb” is fundamentally misguided and ageist. This masks the true impacts of public spending cuts and structural housing market failures.
An ageing population generates significant economic, social, and cultural opportunities for cities. Intergenerational neighbourhoods benefit all residents, while investment in preventative home repairs demonstrates strong returns on investment.
Successful age-friendly urban practice includes:
- “Rightsizing” rather than downsizing approaches that recognise housing decision complexity.
- Integration of health, leisure, library, and community facilities within developments.
- Design for intergenerational connections through cohousing models and shared facilities.
- Addressing practical barriers like public toilet availability and walking surface quality.
- Social programmes that activate built environments and respond to diverse aspirations.
Here, you’ll find the guide.
Commentary from Remco Deelstra’s LinkedIn post.

Healthy Higher Density Living for Families with Children: An Advocacy, Planning and Design Guide
The Healthy Higher Density Living for Families with Children:
An Advocacy Planning and Design Guide (The Guide) has been
developed with the recognition that good design can both improve
the lives of families that are already living in higher-density
and encourage more families to make that choice, resulting in
a sustainable and compact city which accommodates for
diverse needs.
Here, you’ll find the guide and Remco Deelstra’s LinkedIn post.

Global Street Design Guide
The Global Street Design Guide is supporting practitioners to redefine the role of streets in cities around the world. Created with the input of experts from 72 cities in 42 countries, the Guide offers technical details to inform street design that prioritizes pedestrians, cyclists, and transit riders. Here are a few guides:
- Global Street Design Guide
- Designing Streets for Kids Guide
- How to Implement and Evaluate Street Transformations
Here, you’ll find all the excellent Bloomberg Global Street Design Guides.

Design codes for health and wellbeing
This Quality of Life Foundation guide, Design Codes for Health and Wellbeing, provides practical advice for embedding health and wellbeing into the design coding process, ensuring that places support healthier lives for everyone.
This guide is designed for planners, developers, local authorities, public health professionals, and community groups involved in shaping the built environment.
It sets out a policy framework and practical principles for incorporating health into design codes, complementing existing national guidance on placemaking.
By using this guidance, you can develop a vision for health-focused development and ensure that design codes actively support better health outcomes.
You can find the guide here.

A Good Guide from Spain to Healthier Cities
Urban environments house two-thirds of Europe’s population, yet current planning approaches have drifted away from health considerations since addressing 19th-century sanitary challenges. This comprehensive guide presents a compelling framework for creating healthier urban spaces.
This practical tool offers urban professionals both diagnostic frameworks and concrete design guidelines. The guide includes specific assessment questions for evaluating current conditions – such as whether all households are within 1.5km of essential services, or if green spaces are accessible via safe routes for people with limited mobility.
- Walkable Cities: Prioritising active mobility through expanded pedestrian infrastructure. Pontevedra’s transformation demonstrates this approach, reducing cars in the historic centre by 92% whilst creating wider pavements and relocating parking to the city periphery.
- Introducing Nature: Integrating green spaces within 500 metres of all households. Vitoria-Gasteiz’s Green Ring project exemplifies this strategy, creating 42m² of green space per resident within 2.5 minutes’ walking distance through six interconnected parks.
- Meeting and Socialisation Spaces: Designing flexible public spaces that accommodate intergenerational activities. Alicante’s Plaza América intergenerational building successfully combines independent living with shared community facilities.

Planning for quality of life considering community cohesion and related social goals
Most people want their communities to be friendly, fair, affordable, healthy, comfortable and beautiful, and want these quality of life, social or livability goals to be considered in planning. Current transportation planning focuses on economic goals and sometimes environmental goals but tends to overlook and undervalue social goals such as community cohesion, equity, affordability, public fitness, personal security and public realm attractiveness. These omissions bias planning decisions to overinvest in faster but expensive modes and underinvest in slower but more affordable, inclusive and resource-efficient transport options.
You can find the guide here www.vtpi.org/cohesion.pdf and check out Todd Litman’s other fantastic resources on the VTPI website.

Vision Zero and Safe Systems

Climate-friendly and equitable communities: Walkable design standards guidebook
Oregon’s Walkable Design Standards, developed as part of the Climate-Friendly and Equitable Communities (CFEC) program, presents a comprehensive framework for implementing pedestrian-friendly development standards. This initiative, which strives for sustainable and equitable communities through walkable design, offers valuable insights for urban planners and policymakers worldwide. The framework is particularly relevant as cities globally seek solutions for climate change, social equity, and public health challenges. While specifically designed for Oregon municipalities, the framework offers valuable insights and practical tools that can be adapted by cities and communities worldwide.

The 10 Healthy Streets Indicators

Vision for a better city
What makes this analysis particularly valuable for urban professionals is its holistic framework. Rather than treating issues in isolation, the report structures solutions around six interconnected pillars: Housing, Public Space, Mobility, Economic Development, Public Health, and Climate Action.
Key findings include public spaces suffering from deferred maintenance, transport improvements failing to keep pace with needs, and life expectancy declining to its lowest level in decades. Economic inequality persists despite overall growth, with commercial districts in historically underinvested areas facing vacancy and resource shortages.
The report’s 25 actionable recommendations offer concrete pathways forward – from reforming planning processes to creating “Climate Corridors” addressing heat and flooding, to establishing a Public Realm Fund supporting low-income communities.
Developed with input fromover 1,100 civic leaders across 5 years, this integrated approach demonstrates how thoughtful design can address multiple challenges simultaneously.
The positioning of public health and climate action as central to urban planning reflects growing understanding that the built environment fundamentally shapes community wellbeing and urban resilience.

Dementia Friendly Neighbourhood Design Guide
This handbook brings together the myriad efforts that collectively form Singapore’s landscape for a dementia-friendly and inclusive built environment. It presents design guidelines developed from the work of agencies, academics and technical experts across different segments, sectors and asset types (e.g., public housing, parks, transport facilities). Eschewing a prescriptive method, this publication begins by guiding readers on the strategic insights and importance of
adopting a design-thinking approach, to arrive at design considerations that can be applied in response to the needs and contexts of different communities and their neighbourhoods.
Find the guide here.

Specific tools for safer transport
Creating safer school routes: One speed cushion at a time
Retrofitted speed cushions reduce average speeds by half. That’s what Sunshine Coast Council and Sidelines Traffic Pty Ltd uncovered when they dug into the data.
After retrofitting speed cushions at a zebra crossing en route to a local primary school, they measured the before-and-after impact.
You can see the guide here.

AI Playbook for Cities: Harnessing the potential of AI
This guide offers practitioners a systematic six-step framework: Problem Identification, Problem Prioritisation, Solution Identification, Procurement & Implementation, Implementation & Operations, and Impact Assessment. Rather than listing AI use cases, it focuses on the “how” of responsible AI adoption.
The document identifies specific applications transforming city services: dynamic parking management, smart water metering with leak detection, integrated stormwater monitoring, optimised waste management, and automated traffic registration. These demonstrate AI’s potential to enhance service delivery whilst improving quality of life.
Central to the approach is recognising data as the fundamental prerequisite for AI solutions. Cities must address data quality uncertainty, inconsistent standards, and privacy concerns. The guide emphasises building capacity through roles such as Chief Innovation Officers, Data Engineers, Data Scientists, AI Ethicists, and Domain Experts.
The playbook champions “Responsible AI” and “Participatory AI” principles, advocating safety, reliability, equality, inclusivity, non-discrimination, privacy, security, transparency, and accountability. It includes risk categorisation systems and human oversight mechanisms to mitigate algorithmic bias.
You can see the guide here and Remco Deelstra‘s post here

Parking reform guides
Parking and the City
The American Planning Association published The High Cost of Free Parking in 2005. Surprising everyone, this 750-page book on parking was popular enough to reprint, with additions, as an 800-page paperback in 2011. Since then, many people have asked for a shorter version of the book to appeal to general readers who are concerned about the future of cities but don’t want to buy or read an 800-page book about parking.
Parking and the City, 2018, is a shorter, updated version of The High Cost of Free Parking. The chapters report on the research and action on 3 recommended parking reforms:
- remove off-street parking requirements,
- charge the right prices for on-street parking, and
- return the revenue to pay for local public services.
You’re welcome to download Chapter 1 (an overview of The High Cost of Free Parking).
Chapter 22 of Parking and the City by Patrick Siegman shows an excellent step-by-step guide based on his decades long experience with parking reform from the 1990s to today.

The opportunity of reforming parking: A taming traffic deep dive report
“If you plan cities for cars and traffic, you get cars and traffic. If you plan for people and places, you get people and places.” — Fred Kent, urbanist
Parking reform is on the rise in cities around the world, as many look to repeal parking minimums and better manage and price their on-street parking. On and off-street parking, however, are often not managed by the same city staff members, let alone by the same agency. In order to ensure that parking supply and demand are appropriately balanced, cities must understand parking as a holistic ecosystem, with on- and off-street parking ultimately affecting one another.
In The Opportunity of Reforming Parking report, authors underscore this comprehensive approach to parking through five case studies that represent the shift to managing on and off-street parking together: Zurich, Switzerland; San Francisco, USA; Mexico City, Mexico; Montreal, Canada; and Kigali, Rwanda.
You can click The Opportunity of Reforming Parking: A Taming Traffic Deep Dive Report

Transport economics
Measuring the benefit-cost ratio of Active Transport
NSW Health recently released the NSW Active Transport Health Model which provides an evidence-based method for assessing the health impacts of active transport infrastructure. The Model quantifies the health impacts related of physical activity, air pollution and road trauma associated with active transport over the lifetime of a population.
The Model provides a robust, adaptable tool to facilitate decision making on investment in active transport infrastructure in NSW. When used during the strategic planning phase of infrastructure projects, it enables a consistent approach to valuing the health and economic impacts of investing in active transport. See also NSW Heath Active Transport site.

Estimating the benefits of active travel investment
The central question addressed by this think piece is: how can economic appraisal be done better for active travel interventions that do not fit neatly into existing frameworks? Active Travel England, Department for Transport, representatives from academia, civil service, transport authorities and other interested bodies met to discuss ‘transport appraisal guidance and active travel’. This report reflects a determination to move the field forward while aiming to be specific about what the issues are and focusing on what can be done to resolve them. Inclusions are morbidity, wider economic impacts, travel time savings, safety benefits, place quality and urban realm, active travel to reach public transport, embodied carbon from vehicles and infrastructure, and journey quality.
You can read the report here.

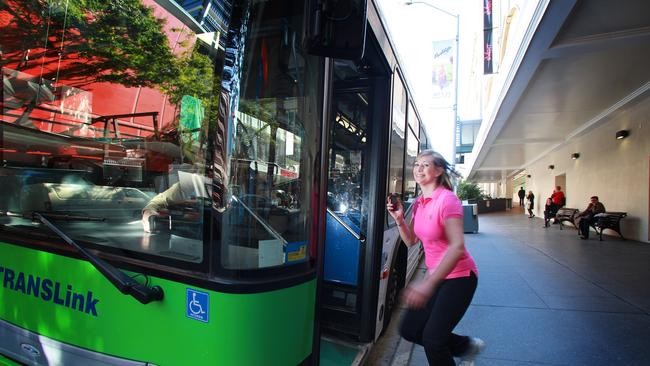
The economics of bus service provision to reduce social isolation
The loneliness is exacerbated when there’s a lack of bus service provision. In Place-based disadvantage, social exclusion and the value of mobility, the transport economics authors use a generalised ordered logit model that accounts for observed and unobserved heterogeneity and derive the marginal effects for each influencing attribute.

Multimodal
Bike racks on the front of buses
The engineering and safety issues which need to be considered are:
- Pedestrian safety: will the rack and/or bicycles at the front of the bus introduce an undue hazard to pedestrians?
- Bus turning and manoeuvring capability: will the extra projection at the front of the bus cause an undue increase in the road space required by the bus during turning or lane-change (entering or leaving the bus stop) manoeuvres? Will the ground clearance at the front be adequate to clear obstacles?
- Road space required at bus stops: will the extra length of the bus cause problems at bus stops, particularly if several buses are lined up?
- Driver visibility: will the rack and/or bike unduly interfere with the bus driver’s view of the roadway?
- Visibility of lights: will the rack and/or bikes obscure the view, by other road users, of the mandatory lights at the front of the bus or the reduce the effectiveness of the bus headlights?
- Cognitive load on the driver: will the extra responsibility of observing the loading and unloading of bicycles place an undue demand on the bus river? If the cyclist forgets to stow the rack after taking the last bicycle out of the rack, will the driver be expected to get out of the bus and do this?
- Global road safety effects: if the provision of bike racks on the front of buses does encourage greater use of bicycles, what are likely to be the overall road safety effects of this trend?
Read the ACT Dept of Urban Services article here.

Communications guides & tools
Media Reporting Guidelines for Road Collisions
Every 20 minutes someone is killed or seriously injured on UK roads. Much of the reporting around these incidents portrays collisions as unavoidable, obscures the presence of certain actors or omits crucial context as to why crashes happen and what we can do to prevent them.
These guidelines were produced in consultation with road safety, legal, media and policing organisations and individuals, to supplement professional codes of conduct and support the highest standards of reporting in broadcast, print and online.

Maryland Transit: Customer experience action plan 2025
The Maryland Transit Administration defines Customer
Experience as the overall journey and interactions that a rider
has while using public transportation services. It includes
every step that a rider takes from trip planning to reaching
their destination.
Customer experience for transit encompasses every touchpoint between the transit system and the passengers, from the moment they plan their trip to the completion of their journey. It includes service reliability, accessibility, safety, cleanliness, and communication provided to passengers to make informed decisions. An improved customer experience ensures that transit is not only functional but also intuitive, welcoming, and responsive to the needs of all riders.
MTA’s CX Action Plan is a focused, short-term roadmap outlining key initiatives implemented within the year to enhance the customer experience. It is not a longterm strategic plan nor an exhaustive list of every effort in this space. Instead, it highlights the impactful and near-term actions aimed at driving meaningful improvements. The plan will be updated annually to reflect progress and to introduce new initiatives.
You can download the action plan here:

Safer speeds on local streets: Communication guide
Applying safer speed limits is one of the most effective ways of improving road safety and creating more liveable neighbourhoods.
Victoria Walks, Common Cause Australia and MAV have collaborated to develop a toolkit for councils on public communications to support the introduction of 40 and 30 km/h speed limits in appropriate locations.
You’ll find all the toolkit components here
- The heart of the Toolkit, the Communication Guide provides messaging and tactical tips to build public support for 40 and 30 km/h limits, based on the rigorous research undertaken for the project.
- Safer speeds Conversations and Objection Handling provides suggestions for how to respond to some common objections to safer speeds.
- The benefits of safer speeds Evidence Summary outlines why 40 and 30km/h are safer and the evidence of road safety and other improvements where safer speeds have been introduced.
- The safer speeds Survey Report provides a summary of the survey results across Victoria and for five council types: inner metro, rest of metro, interface, regional cities and regional shires.

Framing walking and biking message guide
If you’d like to see streets for everyone, everywhere, you’ll want to use Common Cause’s Walking and Bike Riding message guide, prepared for VicHealth and partners. Based on extensive research and advocate experience, our messages build public support for neighbourhoods where everyone can get around in ways that make us happy and healthy.
The guide is written for walking and bike riding advocates and allies who want to create more consistent, compelling and effective narratives on this issue in Australia.

A best practice guide to community consultation and engagement
This Active Travel England guide aims to help people involved in the delivery of major transport teams to:
- include community engagement within transport projects, specifically with a focus on active travel
- set out best practice and case studies for both engagement and consultation
- follow a step-by-step process to include communities in their projects

How to talk about opening our streets for people who walk, ride bikes, and take public transport
This guide by The Workshop gives you tested ways to talk about the changes needed to get all people and goods moving in better ways around our towns and cities. You can use this advice to show people an alternative possibility of how their world could look, to tell stories that change the narrative, and to insert those stories in the public debate.
The theory and research underlying this guide focuses on the power of helpful narratives to influence how people think and talk about the world and what influence this has on concrete political and social change.
How to talk about urban mobility and transport shift
This guide by The Workshop is designed for technical experts,
communicators and advocates working to deliver urban mobility solutions that grow the share of travel by public transport, walking and cycling.¹ Its purpose is to help us use more effective strategies to:
- improve people’s understanding, based on best evidence,
of why a shift in transport modalities away from cars and towards active and public transport is needed - help people designing and leading the shift to have better
conversations with the public - motivate people to act in support of these shifts.

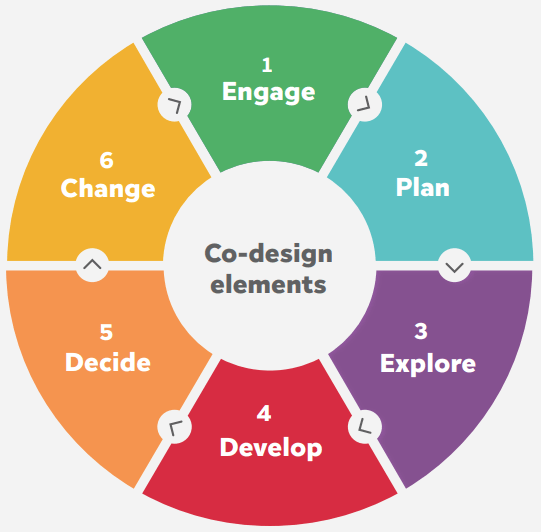
Co-design process for organisations working with people with or without disability
This PWDWA guide is for people who are starting a new service improvement project, developing a new process, product or service, exploring a specific service issue and deciding what to do about it, wanting to understand the experiences of people with disability recieving services, undertaking exploratory work where you may not exactly know the nature of the problem or how you are going to tackle it, and/or implementing changes.
The Mobility Diet tool as a conversation starter
Introducing The Mobility Diet, an innovative narrative-based approach to urban mobility that goes beyond the conventional modal split and binary choice of cars vs public transport vs bikes. This framework advocates for incremental, context-specific changes that are tailored to suit both individual and community needs.
The Mobility Diet delves into the complexities of how we move, recognising that effective solutions must reflect the unique character of each place. This website provides a comprehensive explanation of The Mobility Diet, offering depth and insight beyond the brief soundbites and snippets where it might be seen on social media and online articles.
Listen to our chat with Robert Martin to find out how the Mobility Diet tool came to be.

The Futures Toolkit
The Futures Toolkit by UK Science Office takes you through 12 different Futures Thinking tools, with advice on how to implement them. It also pulls these together into a number of pathways to meet specific objectives.
This set of tools helps you develop policies and strategies that are robust in the face of an uncertain future. Produced in collaboration with SAMI Consulting.
The toolkit is intended to be accessible to people who have little or no experience using these tools, as well as a useful reference for those who are more experienced and a guide for those commissioning Futures projects. It sits alongside other GO-Science Futures resources, including our Brief Guide to Futures Thinking and Foresight, and our Trend Deck.
We focus on how these tools can apply to policy or strategy, but they can be used in many other areas–including more operational or delivery-focused contexts.

Land use
Land use as a strategy for transportation, housing, and the environment: Opportunities for state and local governments
USDOT recently issued a new paper about land use as a strategy to improve transportation. This paper gives in-depth coverage to this relationship, including the graphic on the right showing how minimum parking requirements necessitate additional travel and transportation infrastructure to serve the same amount of housing and destinations.

The hidden wealth of cities: creating, financing, and managing public spaces
Well-designed, community-responsive public spaces generate substantial economic returns. These spaces enhance city livability, resilience, and competitiveness by improving public safety and health outcomes whilst attracting entrepreneurs and talented workforce.
The research identifies five key strategies for cities.
Public spaces should connect with broader city systems, integrating with green infrastructure for flood protection, seeking synergies with cultural heritage assets, and reclaiming streets from vehicular to pedestrian use.
You can read the report here and read Remco Deelstra’s summary here.

Street Space Use and Allocation Resources
Understanding how street space is used and allocated is key to creating people-friendly cities. Explore these resources:
Street Space Allocation and Use in Melbourne’s Activity Centres (Cities People Love article) – A readable overview highlighting the need to rethink street space priorities in Melbourne’s vibrant centres.
Working Paper on Street Space Allocation (2021) – A detailed study of 57 Melbourne activity centres showing how street space was distributed among transport modes, and where opportunities lie to create more equitable streets.
Journal article: Measuring Use of Street Space in Central Cities (2025) – A more advanced study offering new metrics for street space use and discussing the ethics of street allocation, transport justice, and sustainable design strategies.
These resources together provide practical insights, case study evidence, and new thinking on how we can better use our shared street spaces.

Land use & British High Streets: the influence of built form, diversity, and centrality on their historical continuity
Historical Continuity and Diversity, Spatial Factors, Pervasive Centrality, Spatio-Temporal Patterns
Recommendations
- Local Centrality: Planners should focus on supporting the local centrality of high streets to ensure they remain vibrant hubs within their neighbourhoods.
- Land-Use Diversity: Promoting diversity in land use is crucial for the resilience and adaptability of high streets. This can be achieved through flexible regulations and avoiding rigid use classes.
- Place-Based Strategies: Urban regeneration efforts should be more aligned with the historical and socio-spatial context of high streets, emphasizing place-based strategies that consider local conditions.
- Preservation of Spatial Ecology: Maintaining the existing spatial ecology that supports diversity is essential. This includes preserving the relationships between buildings, streets, and their neighbourhoods.
Here’s the article, and Remco Deelstra’s post with more info.

Other
Road safety: A global crisis
Road traffic fatalities and injuries impose high costs on society, especially on the poor and the working-age population. In addition to the loss of life and toll on human health, they result in lost productivity, property damage, legal and judicial costs, out-of-pocket expenses, and public healthcare expenditures. Road crashes cost low and middle-income economies the equivalent of 2-6% of their GDP each year.
Without urgent action, road traffic crashes will keep rising as the demand for mobility in low and middle-income countries grows.
You click here for the Global Road Safety Facility guides.